参考:https://www.cnblogs.com/emanlee/p/5373649.html
先放一个gallery里的例子
 # library
library(ggplot2)

# create a dataset
specie <- c(rep("sorgho" , 3) , rep("poacee" , 3) , rep("banana" , 3) , rep("triticum" , 3) )
condition <- rep(c("normal" , "stress" , "Nitrogen") , 4)
value <- abs(rnorm(12 , 0 , 15))
data <- data.frame(specie,condition,value)

# Grouped
ggplot(data, aes(fill=condition, y=value, x=specie)) +
    geom_bar(position="dodge", stat="identity")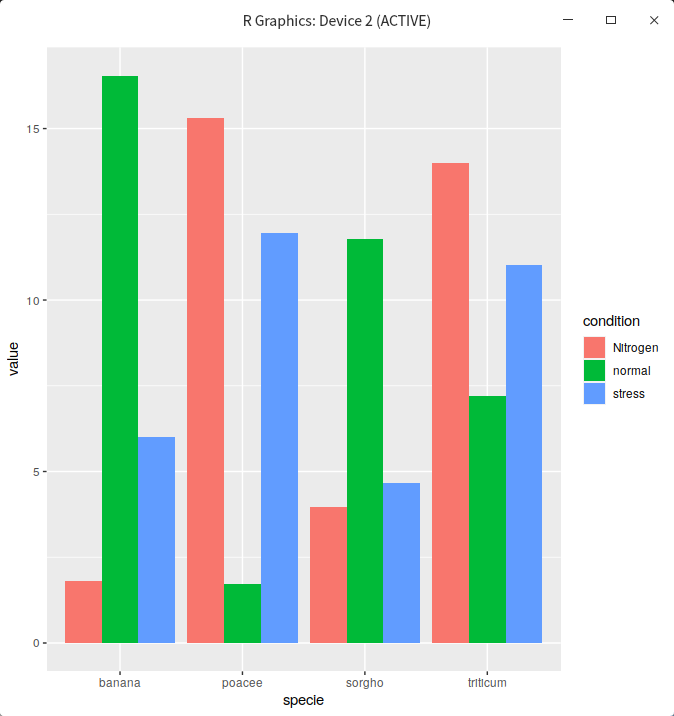
然后改theme里的legend.key.size就好了
last_plot() + theme(legend.key.size = unit(0.1, "inches"))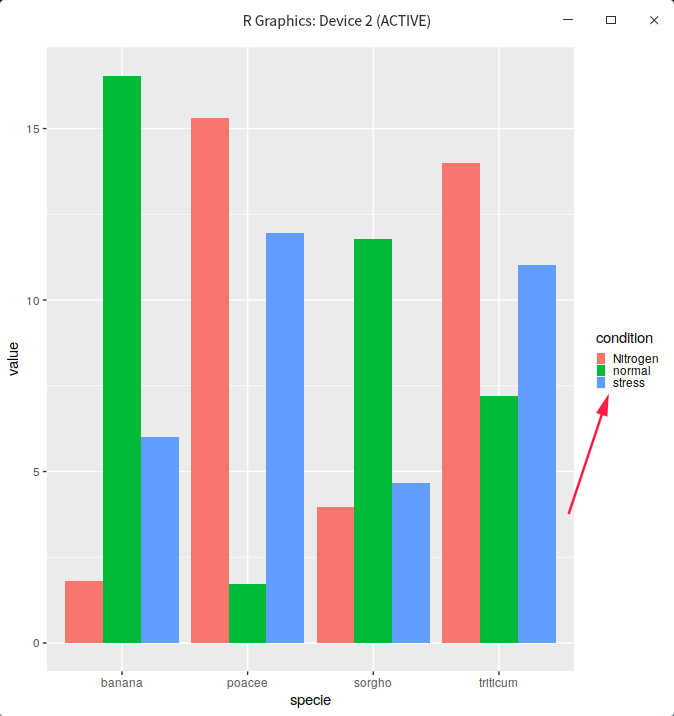
图例就变小了。然后还可以通过调整legend.margin来调整图例四周的空白区域的大小,这在把图例嵌入到图中时很有用。